Thermal mapping — also called temperature mapping — documents how temperature (and often humidity) varies across a storage space or chamber over time. It is expected under GDP and GMP for pharmaceutical storage, and it is good practice for any temperature-controlled space. This guide walks through a typical study.
When is mapping needed?
- Before a new warehouse, cold room or chamber is put into use
- After significant changes — new racking, HVAC changes, layout changes
- Periodically, and seasonally for spaces affected by outside weather
- After unexplained temperature excursions
International guidance such as the WHO technical supplement on temperature mapping of storage areas describes the expectations in detail.
Step 1: Write the protocol
Define the scope, the acceptance criteria (for example +2 °C to +8 °C for a cold room, or 15 °C to 25 °C for a warehouse), the study duration, the logger layout and what tests you will run, such as door-opening or power-failure tests.
Step 2: Design the logger grid
Loggers are placed in a three-dimensional grid so every part of the space is covered:
- At low, middle and high levels — heat rises, so the top of racking is often warmest
- In corners and along external walls
- Near doors, docks and cooling units, where conditions change fastest
- Close to where product is actually stored
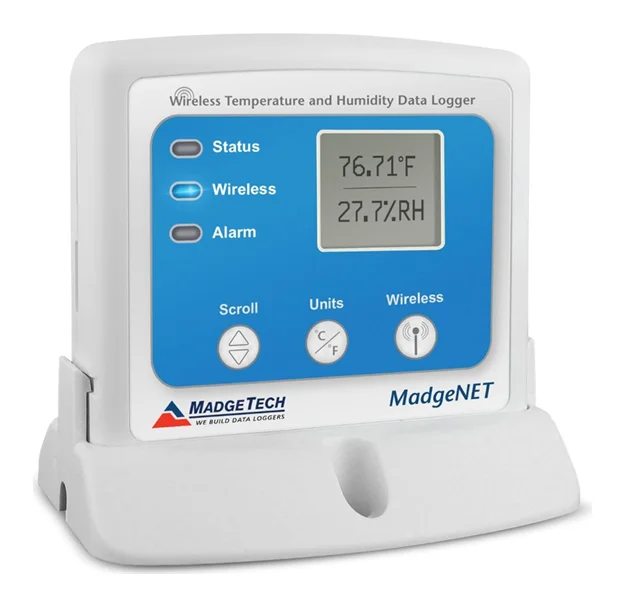
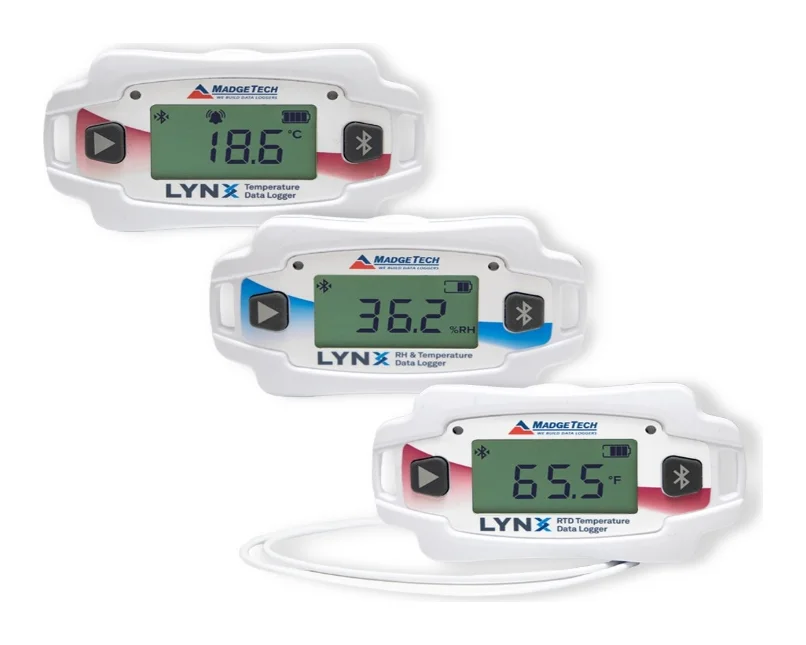
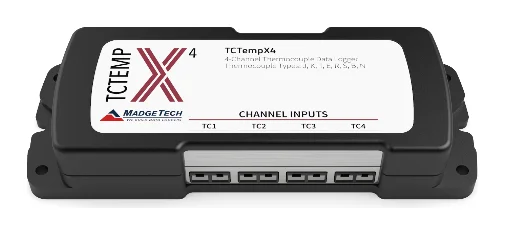
Larger spaces need more loggers. Wireless loggers such as the RFRHTemp2000A and Bluetooth LynxPro-RH make large grids practical; for chambers and ovens, a multi-channel TCTempX with thermocouples covers many points from one logger.
Step 3: Check logger calibration
Every logger must have a valid calibration certificate covering the mapping range. See data logger calibration and ISO 17025.
Step 4: Run the study
- Record at a suitable interval, often every 1–5 minutes.
- Run for long enough to capture normal operation — commonly 24–72 hours for chambers and 7 days or more for warehouses.
- Include normal activity: deliveries, door openings and weekend patterns.
- For spaces affected by the weather, repeat the study in summer and winter.
Step 5: Analyse and report
The report should show each logger's minimum, maximum and average; identify hot and cold spots; flag excursions against the acceptance criteria; and recommend where to place permanent monitoring sensors, usually at the identified extremes.
After mapping
Use the results to position a continuous monitoring system, adjust storage zones or fix airflow problems — and remap after significant changes.
This guide is part of our
Thermal Mapping