Thermal mapping (temperature mapping) measures how temperature — and often humidity — varies across a storage area or chamber over time. It reveals hot and cold spots, shows how the space reacts to door openings and seasonal changes, and tells you where to place your permanent monitoring sensors. Regulators and auditors expect it for GDP and GMP storage.
What we map
- Warehouses and distribution centres
- Cold rooms, walk-in chillers and freezers
- Pharmaceutical and vaccine refrigerators
- Stability chambers, incubators and ovens
- Reefer trucks and temperature-controlled vehicles
Our mapping process
- Protocol — we agree the acceptance criteria, study duration and logger layout with you.
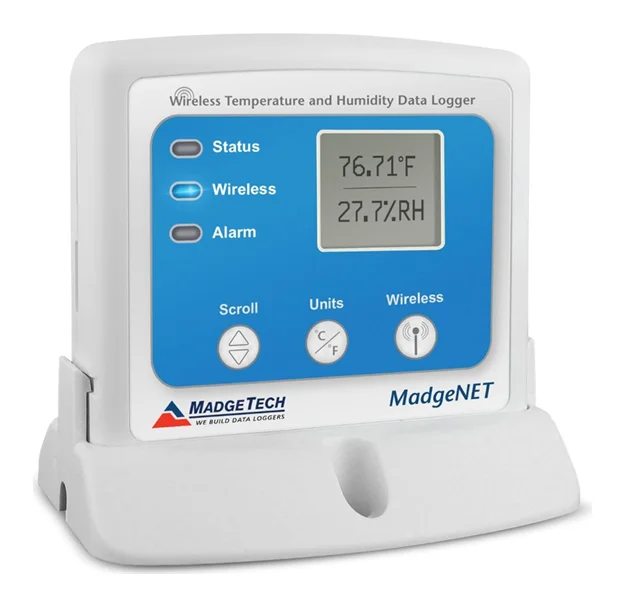
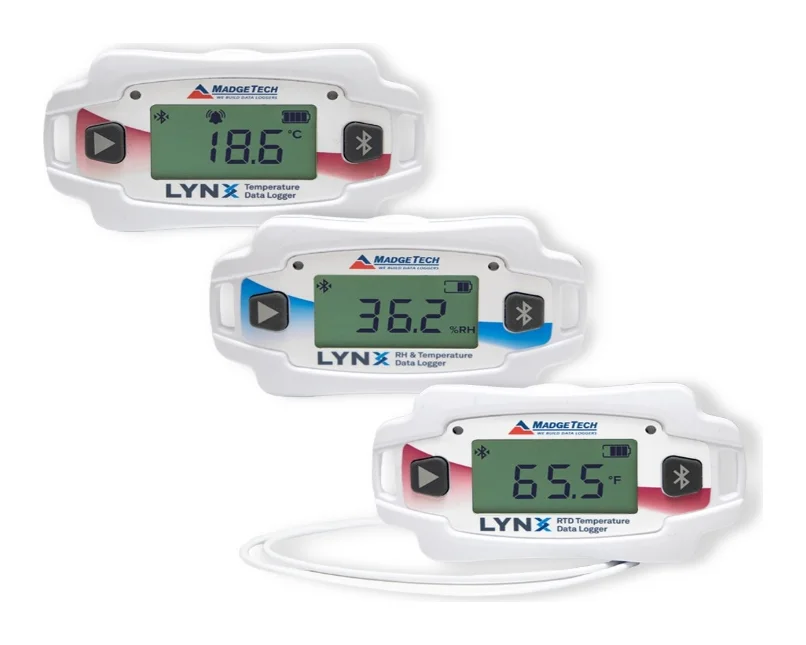
- Placement — calibrated loggers such as the RFRHTemp2000A or LynxPro-RH are placed in a 3D grid, including corners, doors and different heights.
- Data collection — loggers record through normal operation, door openings and, where required, power-off tests.
- Report — you receive a report with temperature profiles, hot and cold spots, excursions and recommended sensor positions for routine monitoring.
Deliverables
- Mapping protocol and logger layout drawing
- Raw data and calibration certificates for every logger used
- Summary report with conclusions and recommendations
Read our step-by-step thermal mapping guide, or ask about data logger rental if you'd rather run the study yourself.
Frequently asked questions
How long does a mapping study take?
Typical studies record for anything from 24 hours for a chamber to 7 days or more for a warehouse, often repeated in summer and winter to capture seasonal extremes.
How many data loggers are needed?
It depends on the size and layout of the space. We design a three-dimensional logger grid covering corners, doors, height levels and areas near cooling units, in line with WHO guidance on temperature mapping of storage areas.
Do you supply the loggers for the study?
Yes. We can use our own calibrated loggers through our rental service, or your existing MadgeTech loggers.